betfaiR
betfair_theme
betfair_theme is a simple ggplot2 theme that can be used when plotting any betfair data. The theme is used when plotting the output of the statement method found in bf_account environment, which will plot your Betfair balance (profit/loss) over a specified time period.
arguments
| param | details |
|---|---|
base_size |
font size |
base_family |
font family |
examples
Using some of the data found in vignette_three, rather than posting my Betfair balance :-)
library(ggplot2)
library(dplyr)
library(betfaiR)
arslei <- readRDS("vignette_two/arslei.RDS")
markets <- readRDS("vignette_two/marketIds.RDS")
winner <- readRDS("vignette_two/winner.RDS")
winner <- plyr::ldply(winner, .fun = function(i) {
x <- plyr::ldply(i$runners, .fun = function(j) {
j$basic
})
x$collectedAt <- i$collectedAt
return(x)
})
winner <- winner %>%
left_join(markets$winner[[1]]$runners)
arslei <- plyr::ldply(arslei, .fun = function(i) {
x <- plyr::ldply(i$runners, .fun = function(j) {
j$basic
})
x$collectedAt <- i$collectedAt
return(x)
})
arslei <- arslei %>%
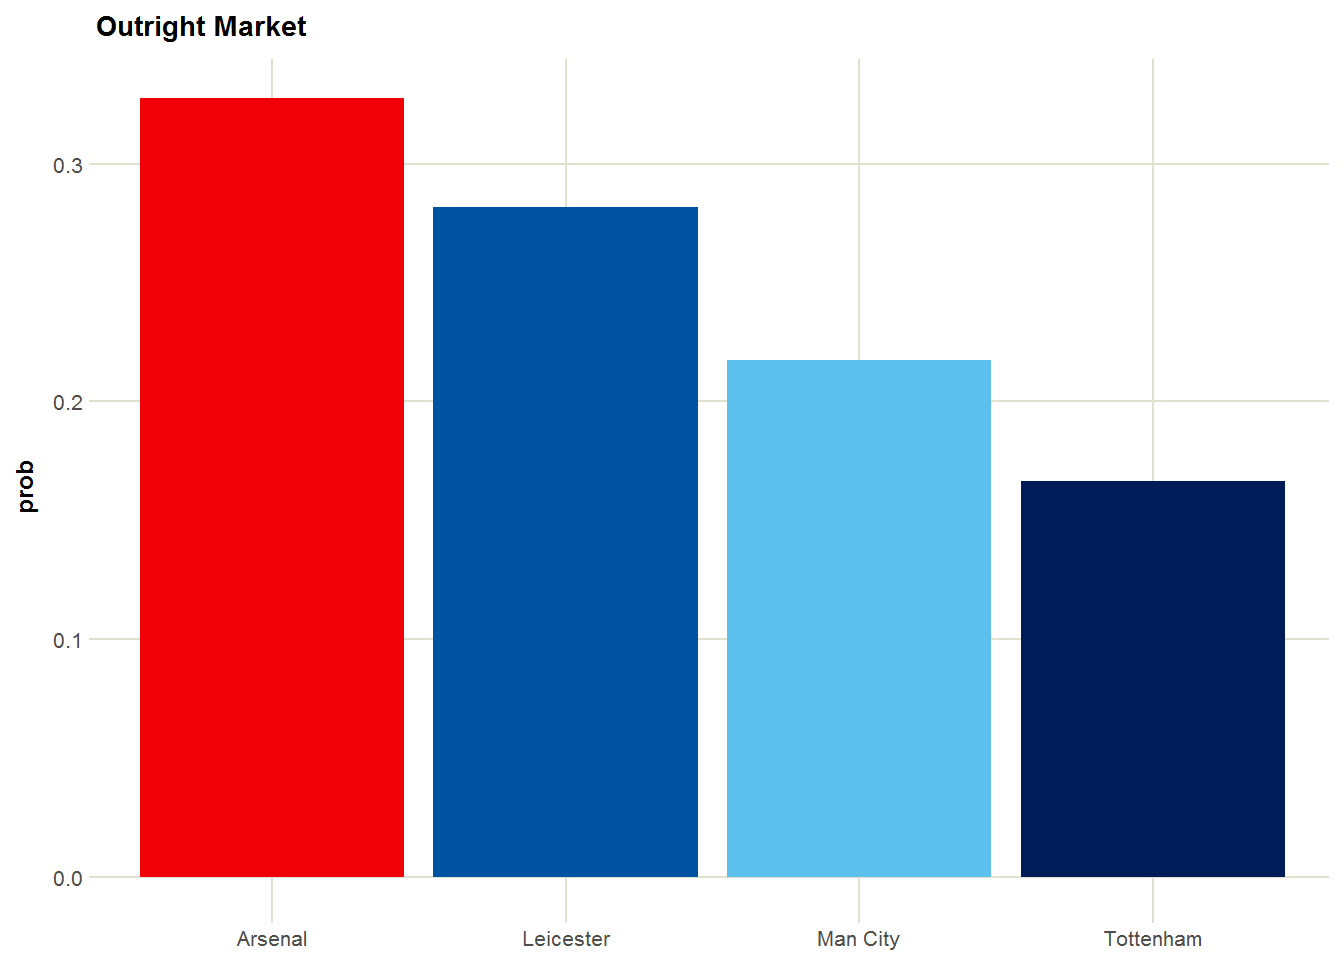
left_join(markets$arslei[[1]]$runners)winner %>%
filter(collectedAt == min(collectedAt),
runnerName %in% c("Arsenal", "Leicester", "Man City", "Tottenham")) %>%
mutate(runnerName = factor(runnerName, levels = c("Arsenal", "Leicester", "Man City", "Tottenham")),
prob = 1 / lastPriceTraded) %>%
ggplot(aes(x = runnerName,
y = prob)) +
geom_bar(stat = "identity",
aes(fill = runnerName)) +
scale_fill_manual(values = c("Leicester" = "#0053A0",
"Arsenal" = "#EF0107",
"Man City" = "#5DBFEB",
"Tottenham" = "#001C58")) +
labs(title = "Outright Market") +
betfair_theme() +
theme(
legend.position = "none",
axis.title.x = element_blank()
)
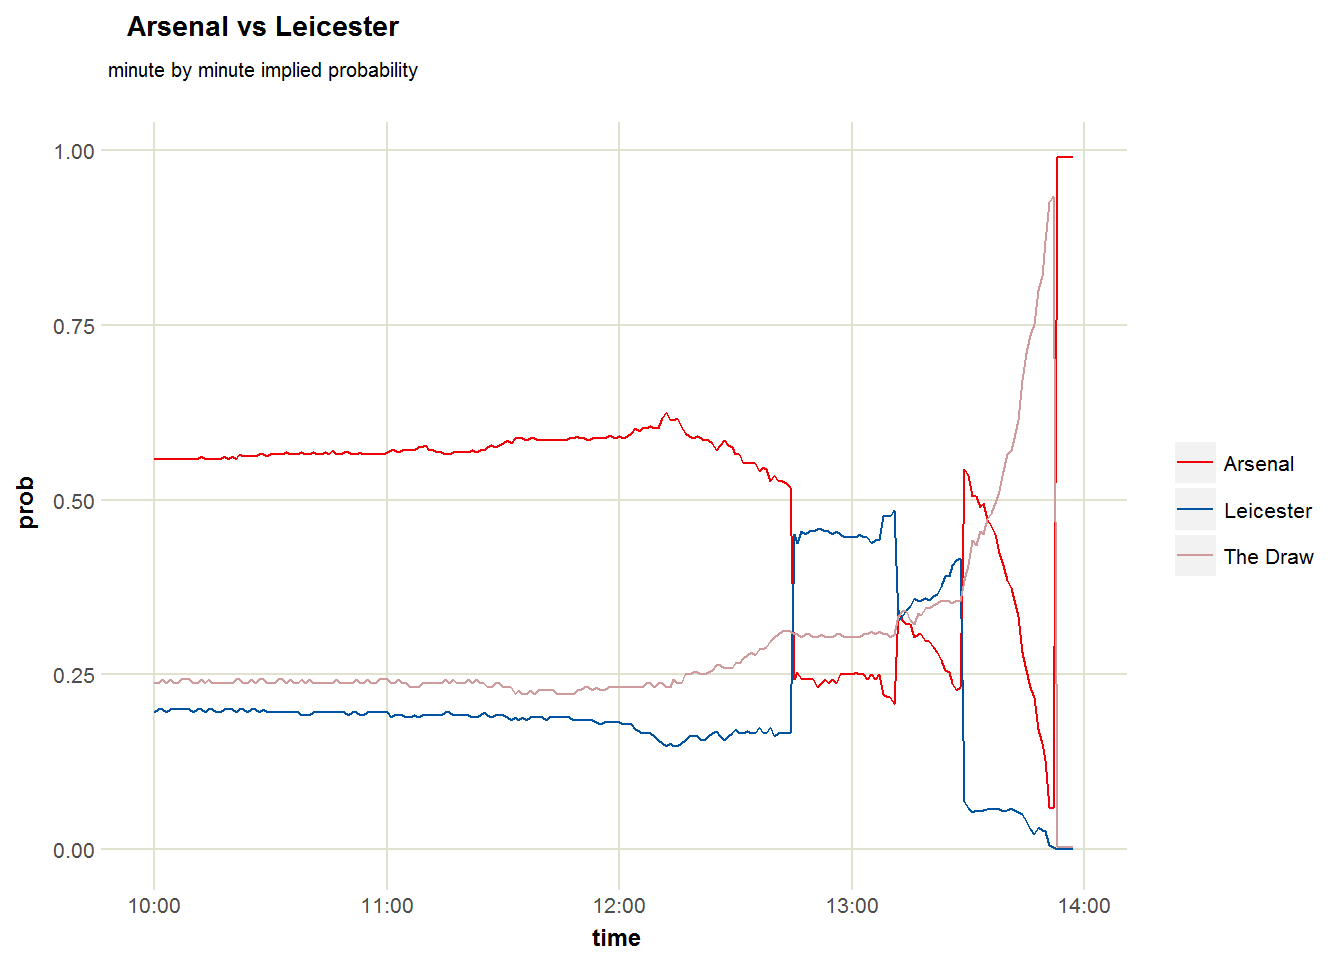
arslei %>%
    ggplot(aes(x = collectedAt,
               y = 1 / lastPriceTraded)) +
        geom_line(aes(colour = factor(runnerName))) +
        labs(x = "time",
             y = "prob") +
        title_with_subtitle(title = "Arsenal vs Leicester",
                            subtitle = "minute by minute implied probability") +
        scale_colour_manual(values = betfair_palette) +
        betfair_theme() +
        theme(
            legend.title = element_blank()
        )
## Warning: Removed 6 rows containing missing values (geom_path).