fantasysocceR
players201415
The players201415 dataset contains summary data for individual players in the fantasy.premierleague.com game, the dataset was updated the day after the 2014/15 seasons started so player values reflect final values. To see player values at the start of the season, then this can be seen in the season201415 dataset, which contains weekly data for all players in the game.
Once the package has been loaded, to access the dataset:
data(players201415)The dataframe has dimensions 711 rows and 7 columns.
str(players201415)## 'data.frame': 711 obs. of 7 variables:
## $ id : num 1 2 3 4 5 6 7 8 9 10 ...
## $ name : chr "Szczesny" "Koscielny" "Vermaelen" "Gibbs" ...
## $ pos : chr "Goalkeeper" "Defender" "Defender" "Defender" ...
## $ team : chr "Arsenal" "Arsenal" "Arsenal" "Arsenal" ...
## $ pts : num 47 120 0 76 94 121 92 0 77 36 ...
## $ value: num 5.2 6.1 5 5.2 5 6.1 4.9 4.3 4.8 6.3 ...
## $ pct : num 4.7 9.9 0.1 1.7 0.8 5.2 3.5 0.1 6.9 2.3 ...There are 7 variables, the players position (‘pos’), their team, points scored last season (‘pts’), id number, name, value (when the package was created), and the percentage of teams the player is selected in (‘pct’)
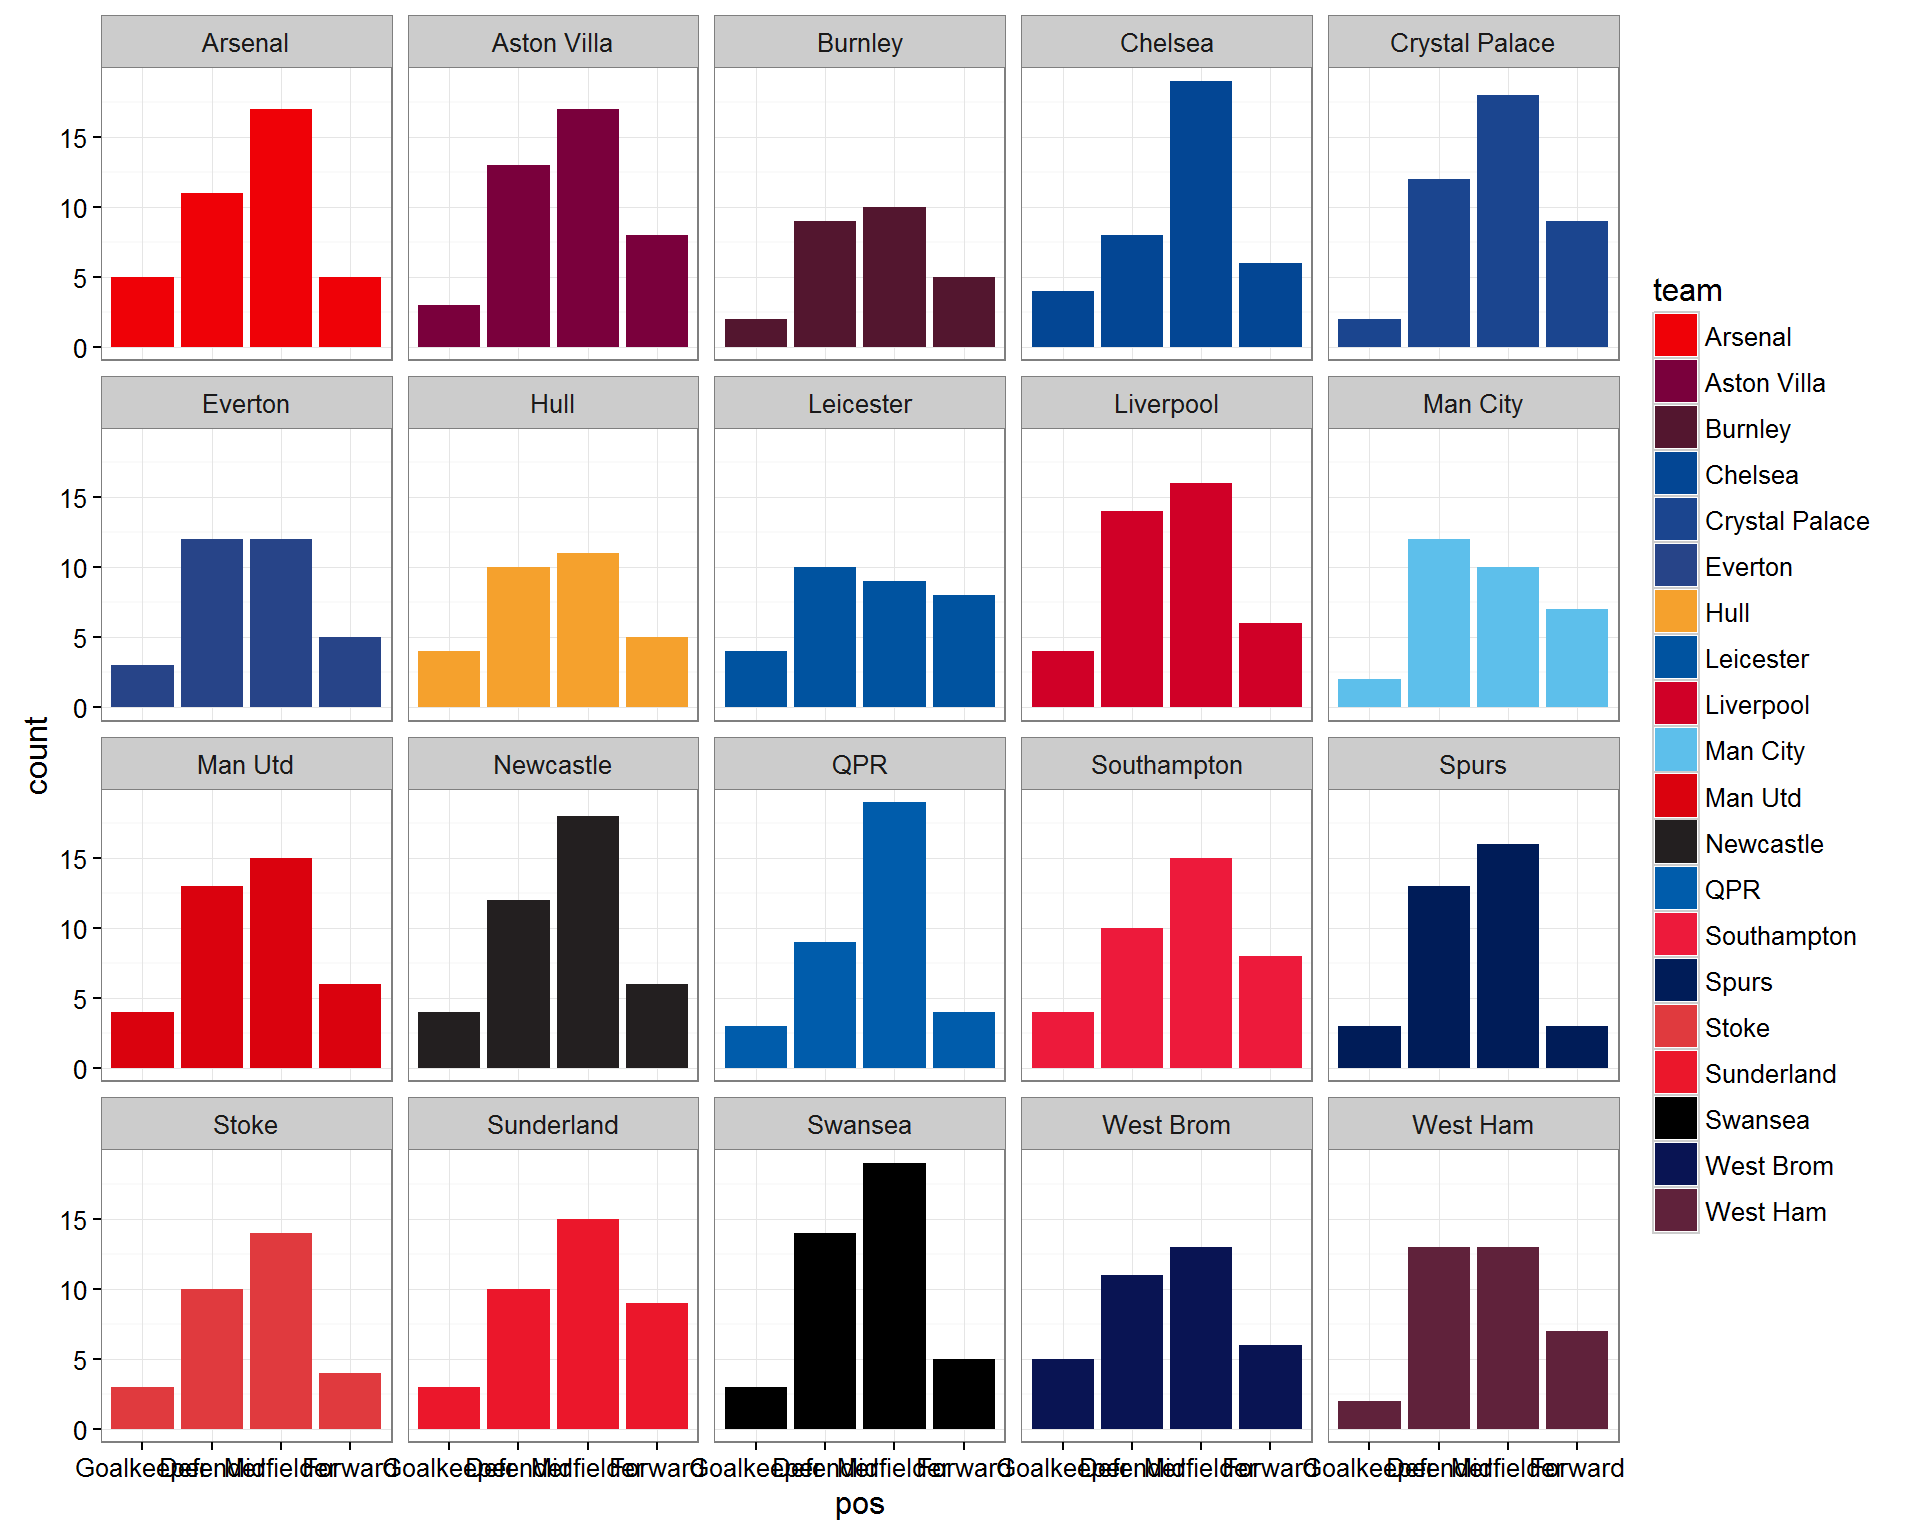
A simple plot of this data to show the number of players in each position at each of the 20 clubs. We can also use the team_pal() function included in the package.
players201415$pos <- factor(players201415$pos, levels = c("Goalkeeper", "Defender",
                                                          "Midfielder", "Forward"))
ggplot(players201415, aes(x=pos, fill=team)) +
    geom_bar() +
    theme_bw() +
    scale_fill_manual(values = team_pal()) +
    facet_wrap(~team)