servevolleyR
simSets
Simulate many sets between two players given a number of parameters, that include probability of each player winning a point on their first serve, on their second serve, and the probability that their first serve will go in. This function returns a detailed list with data about the games within each simulated set.
Usage
simSets(n = 1000, pA, pB,
        playTiebreak = TRUE, players = c("A", "B"),
        p2A = NULL, firstServeA = NULL,
        p2B = NULL, firstServeB = NULL,
        .progress = "none")
Arguments
| param | details |
|---|---|
| n | number of simulations (default is 1000) |
| pA | probability of player A winning point on their first serve |
| pB | probability of player B winning point on their first serve |
| playTiebreak | play tiebreak in the event the set reaches 6 games all |
| players | player names (vector of length 2) |
| p2A | probability of player A winning point on their second serve |
| firstServeA | probability of player A’s first serve being in |
| p2A | probability of player B winning point on their second serve |
| firstServeB | probability of player B’s first serve being in |
| .progress | plyr’s progress bar |
Return
Unlike using replicate on simSet, using simSets will return a detailed list, containing data about the simulated sets rather than just the results of those simulations.
Methods
There are a number of generic methods available for an object returned by simSets, these are print, summary and plot, example use is show below.
Example
egSets <- simSets(n = 100,
                  pA = .78, pB = .70, p2A = .56, p2B = .6,
                  firstServeA = .67, firstServeB = .7)
The object egSets has a class of svR_sets which comes with a few methods
egSets##
## Simulation of 100 sets:
##
## Server Probabilities:
## player p p2 firstServe
## A 0.78 0.56 0.67
## B 0.70 0.60 0.70
##
## Player A (A) won 0.63 of sets.summary(egSets)##
## Simulation of 100 sets:
##
## Server Probabilities:
## player p p2 firstServe
## A 0.78 0.56 0.67
## B 0.70 0.60 0.70
##
## Player A (A) won 0.63 of sets.
## playerB
## playerA 1 2 3 4 5 6 7
## 2 0.02
## 3 0.01
## 4 0.09
## 5 0.09
## 6 0.03 0.02 0.27 0.05 0.16
## 7 0.09 0.17plot(egSets)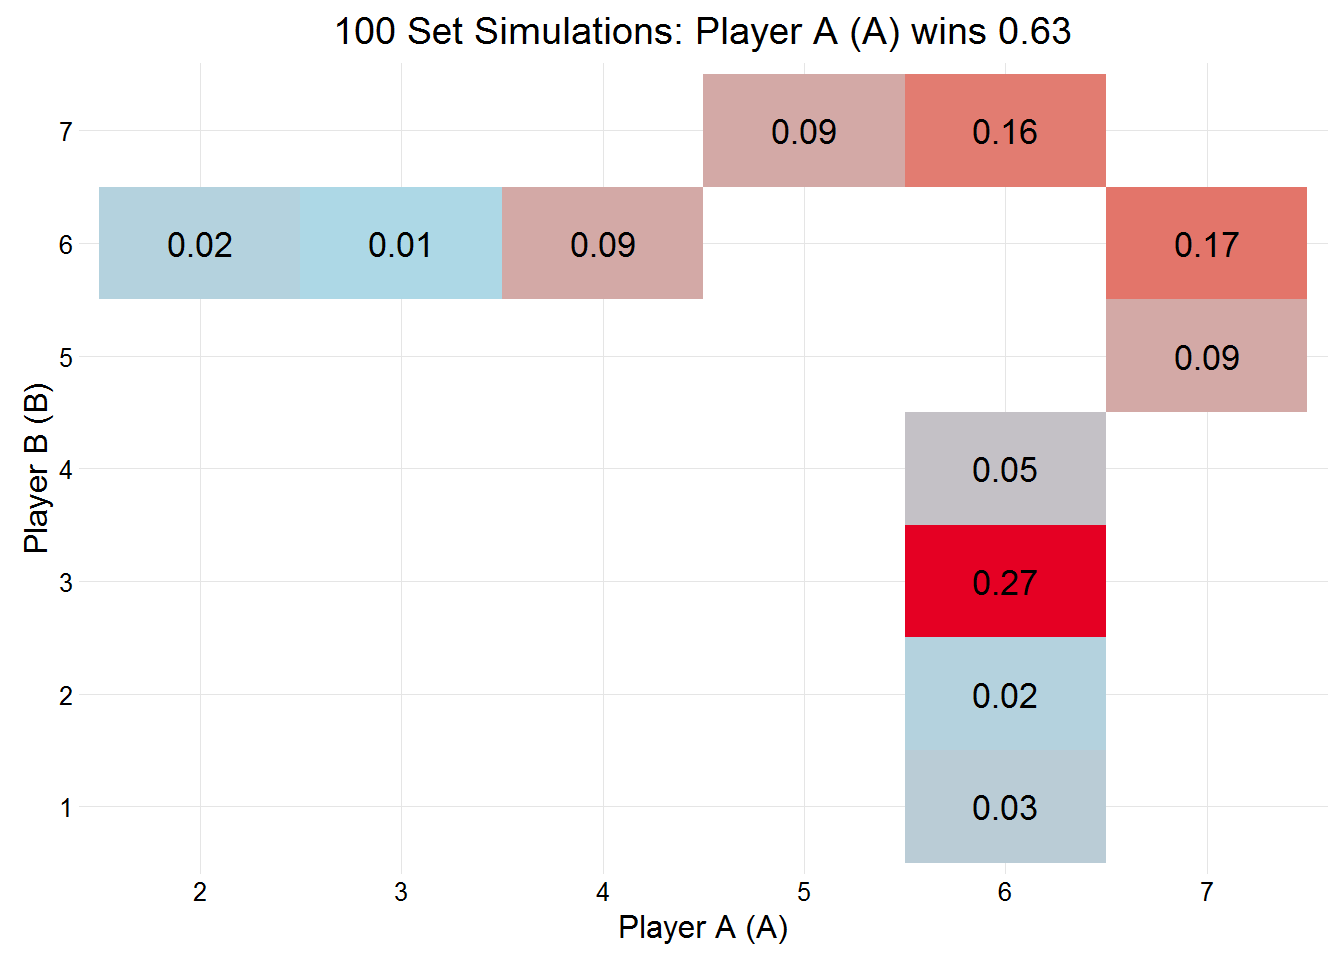
Using simDf
If detail = TRUE then the list can also be entered into the function simDf which will convert the simulated sets into a dataframe.
df <- simDf(egSets)
head(df)
## simNo pA pB setA setB set_res gameNo serving p p2 firstServe
## 1 1 A B 6 3 1 1 A 0.78 0.56 0.67
## 2 1 A B 6 3 1 2 B 0.70 0.60 0.70
## 3 1 A B 6 3 1 3 A 0.78 0.56 0.67
## 4 1 A B 6 3 1 4 B 0.70 0.60 0.70
## 5 1 A B 6 3 1 5 A 0.78 0.56 0.67
## 6 1 A B 6 3 1 6 B 0.70 0.60 0.70
## game_res server returner
## 1 1 4 1
## 2 1 4 2
## 3 1 4 0
## 4 1 4 0
## 5 1 4 2
## 6 0 1 4The dataset contains the following variables:
| variables | about |
|---|---|
| simNo | simulation number |
| pA | player A |
| pB | player B |
| setA | games won by player A |
| setB | games won by player B |
| set_res | set result (1 if player A wins, 0 if player B wins) |
| gameNo | game number in set |
| serving | player serving |
| p | probability of server winning a point on their first serve |
| p2 | probability of server winning a point on their second serve |
| firstServe | probability of first serve being in |
| game_res | game result (1 if server wins, 0 if returner wins) |
| server | number of points won by server in service game |
| returner | number of points won by returner in service game |