2015 Oaks
About
This page quickly walks through how sectionals were calculated that are visualised here.
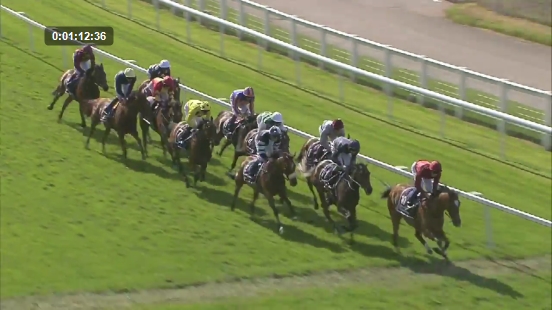
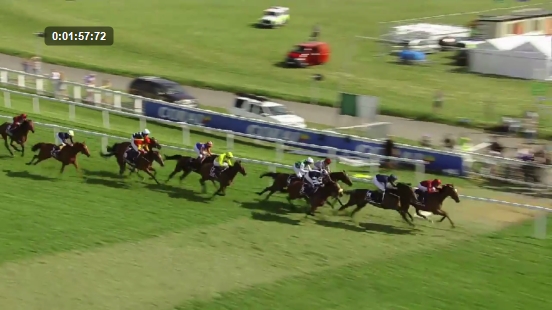
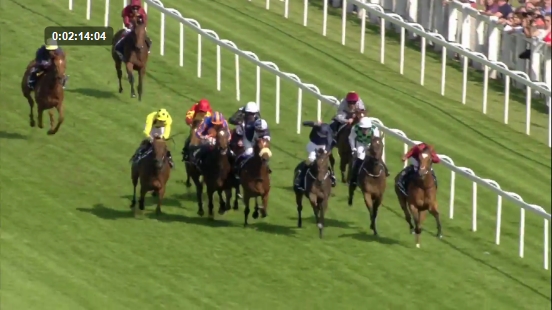
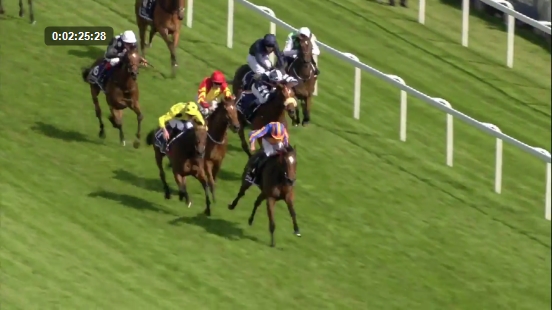
First I downloaded a version of the race from youtube and loaded it into Kinovea, which is a free piece of video editing software for sports. A stopwatch was added to the screen, and was started as the gates opened for the Oaks. I used my past experience of calculating sectionals for the Derby and Oaks in 2013, and used paths which are consistent year on year. Two paths at roughly 5f and 8.5f were used, and then furlong poles at 10f and 11f.
The four screenshots below show the paths used, the screenshots can be found here. Each screenshot is used to estimate the lengths between runners. Sometimes this is relatively easy, the second image, taken after roughly 8.5furlongs sees the field side on, allowing easy calculations, while the two screenshots for 10furlongs and 11furlongs are much tougher as runners are head on. A simple 6 lengths per second scale was used.
5f

8.5f

10f

11f

The table below shows the cumulative distance (in lengths) that I estimated runners were behind the leader.
These beaten lengths were then used, with the leaders time (seen in each screenshot), to calculate the different variables that are found in the actual visualisation. To calculate them I used my R package, called RcappeR. The script here calculates cumulative times, sectional times, finishing speeds, seconds behind leader, and positions at each sectional. If anyone spots any discrepencies please highlight them.
| Pos | Horse | 5f | 8.5f | 10f | 11f | 12f |
| {{ runner.pos }} | {{ runner.horse }} | {{ runner.len5f }} | {{ runner.len8_5f }} | {{ runner.len10f }} | {{ runner.len11f }} | {{ runner.len12f }} |